Data Company - Digital Shipping Report
The state of the shipping industry in data visualization.
CATEGORY
Digital Design
Multi-Page Layout
Interactive Design
Infographic Design
OPPORTUNITY
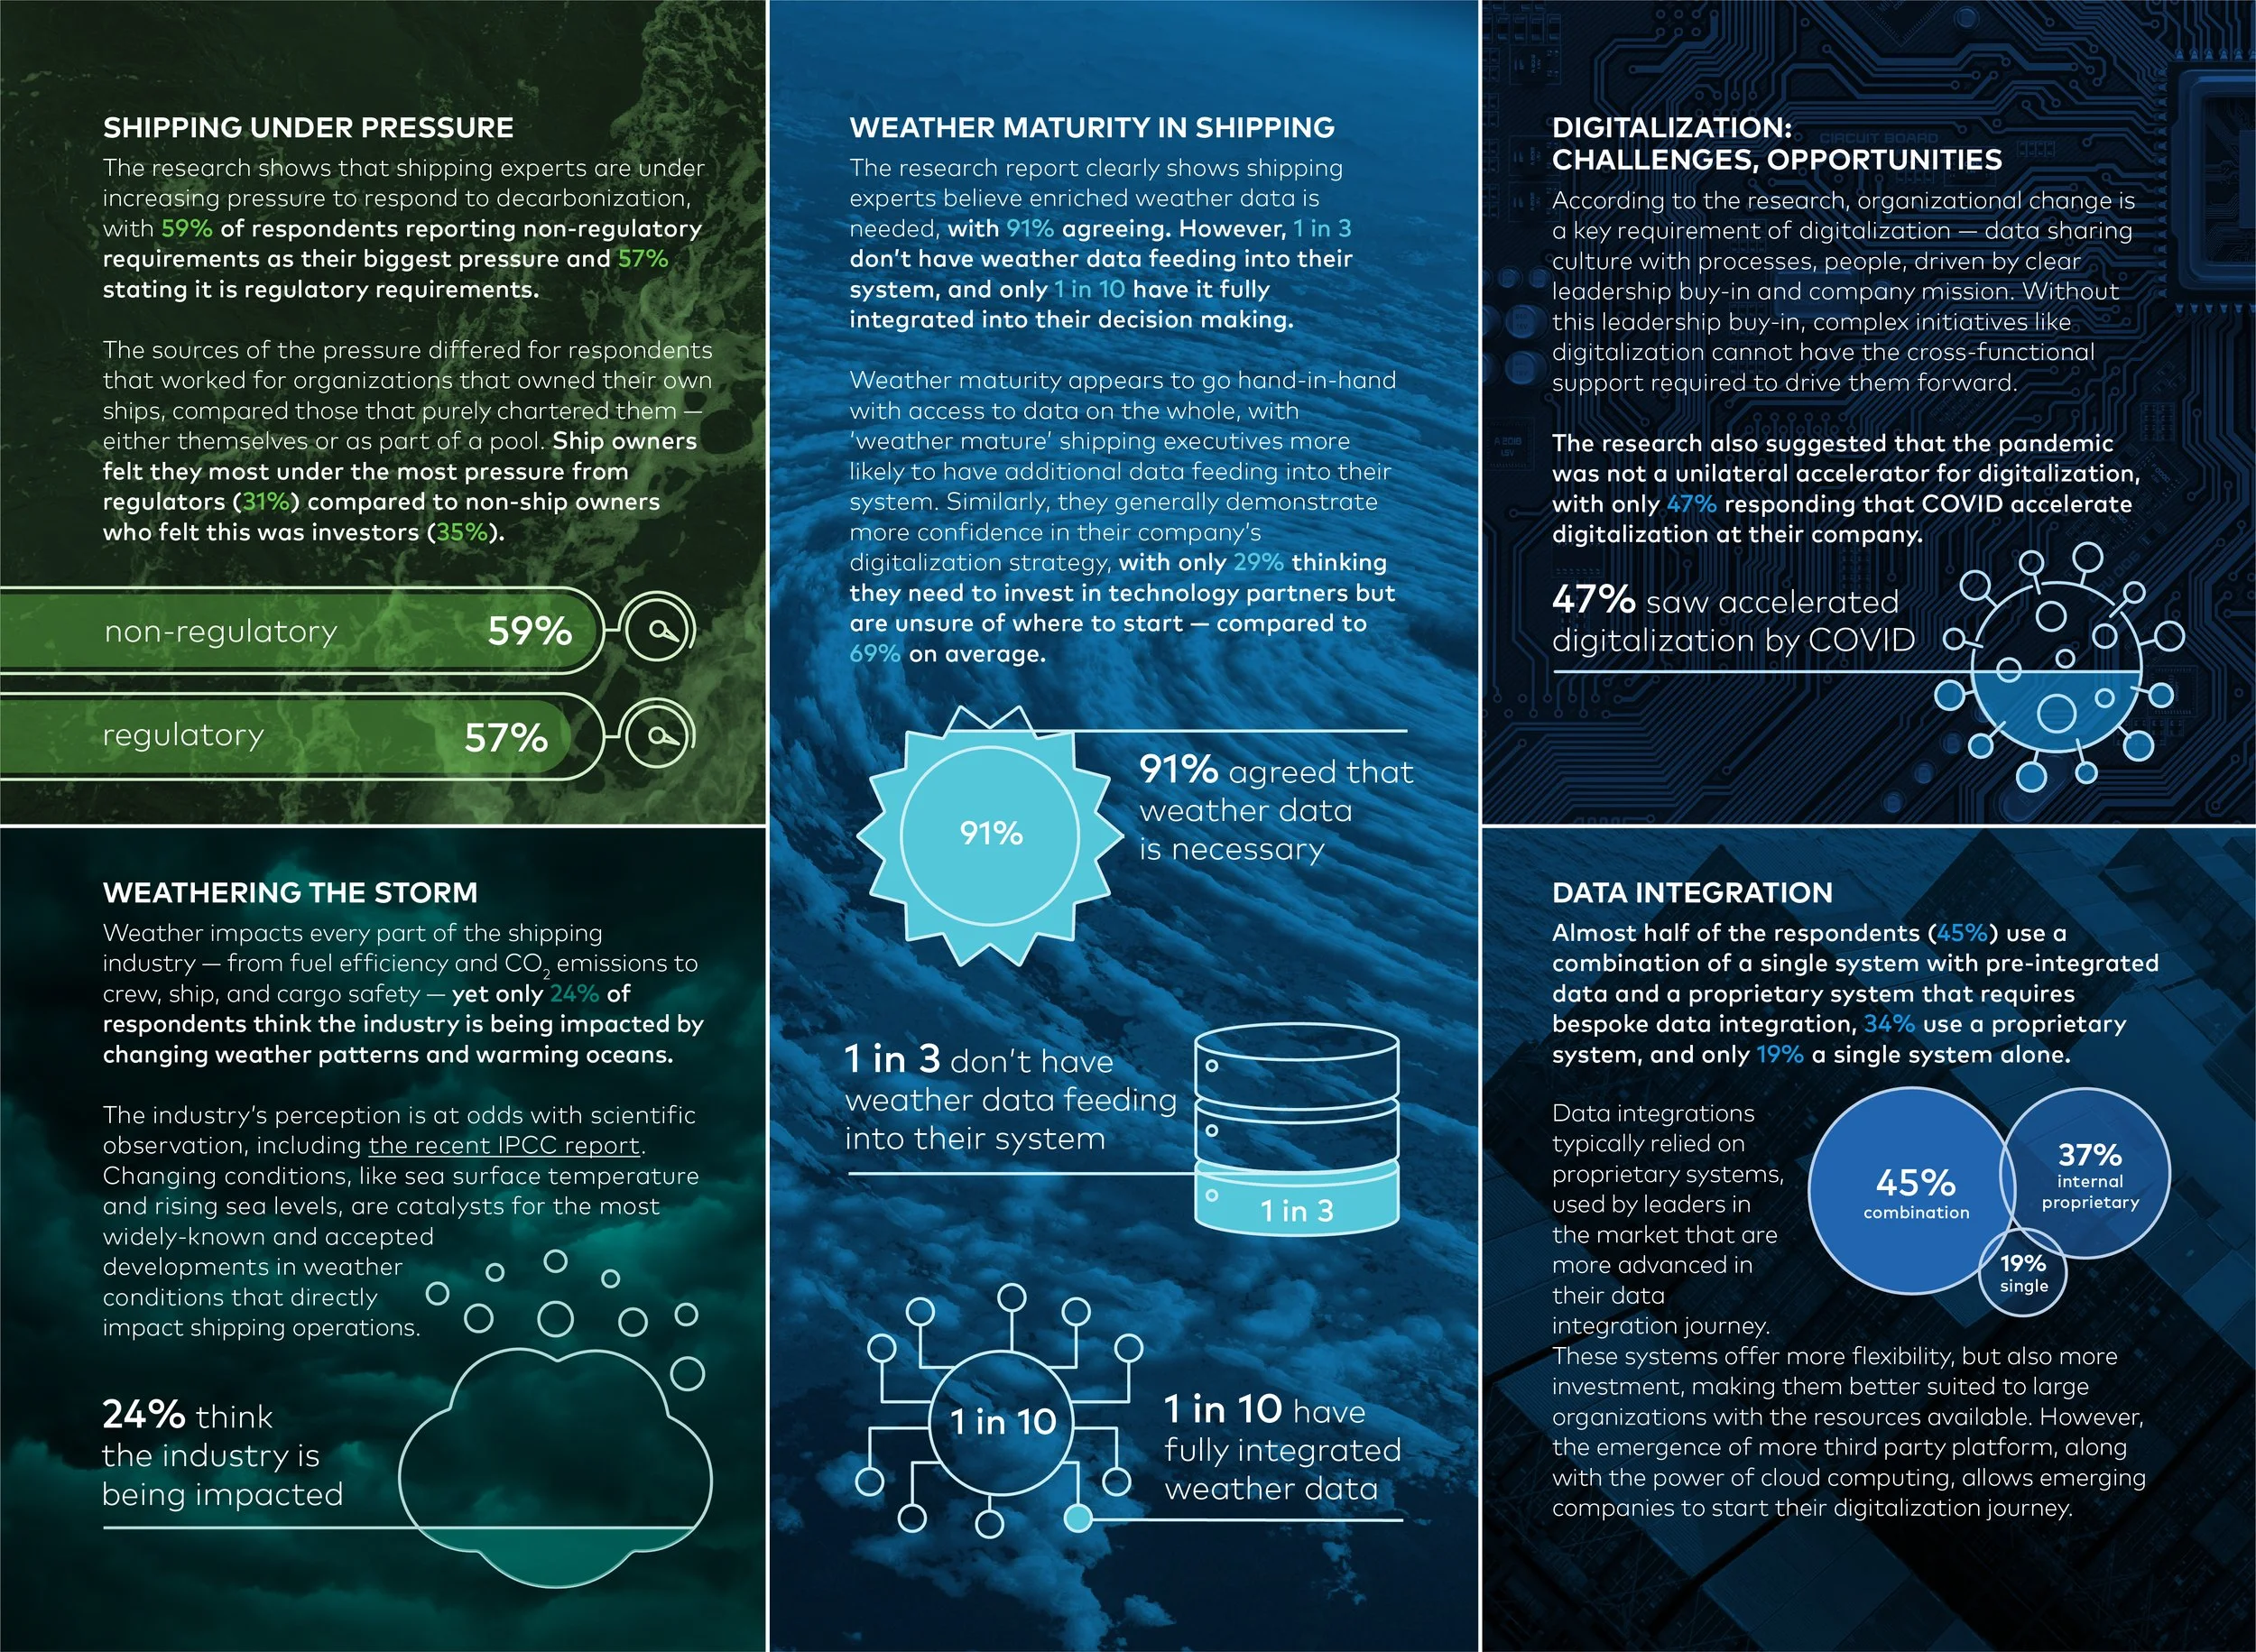
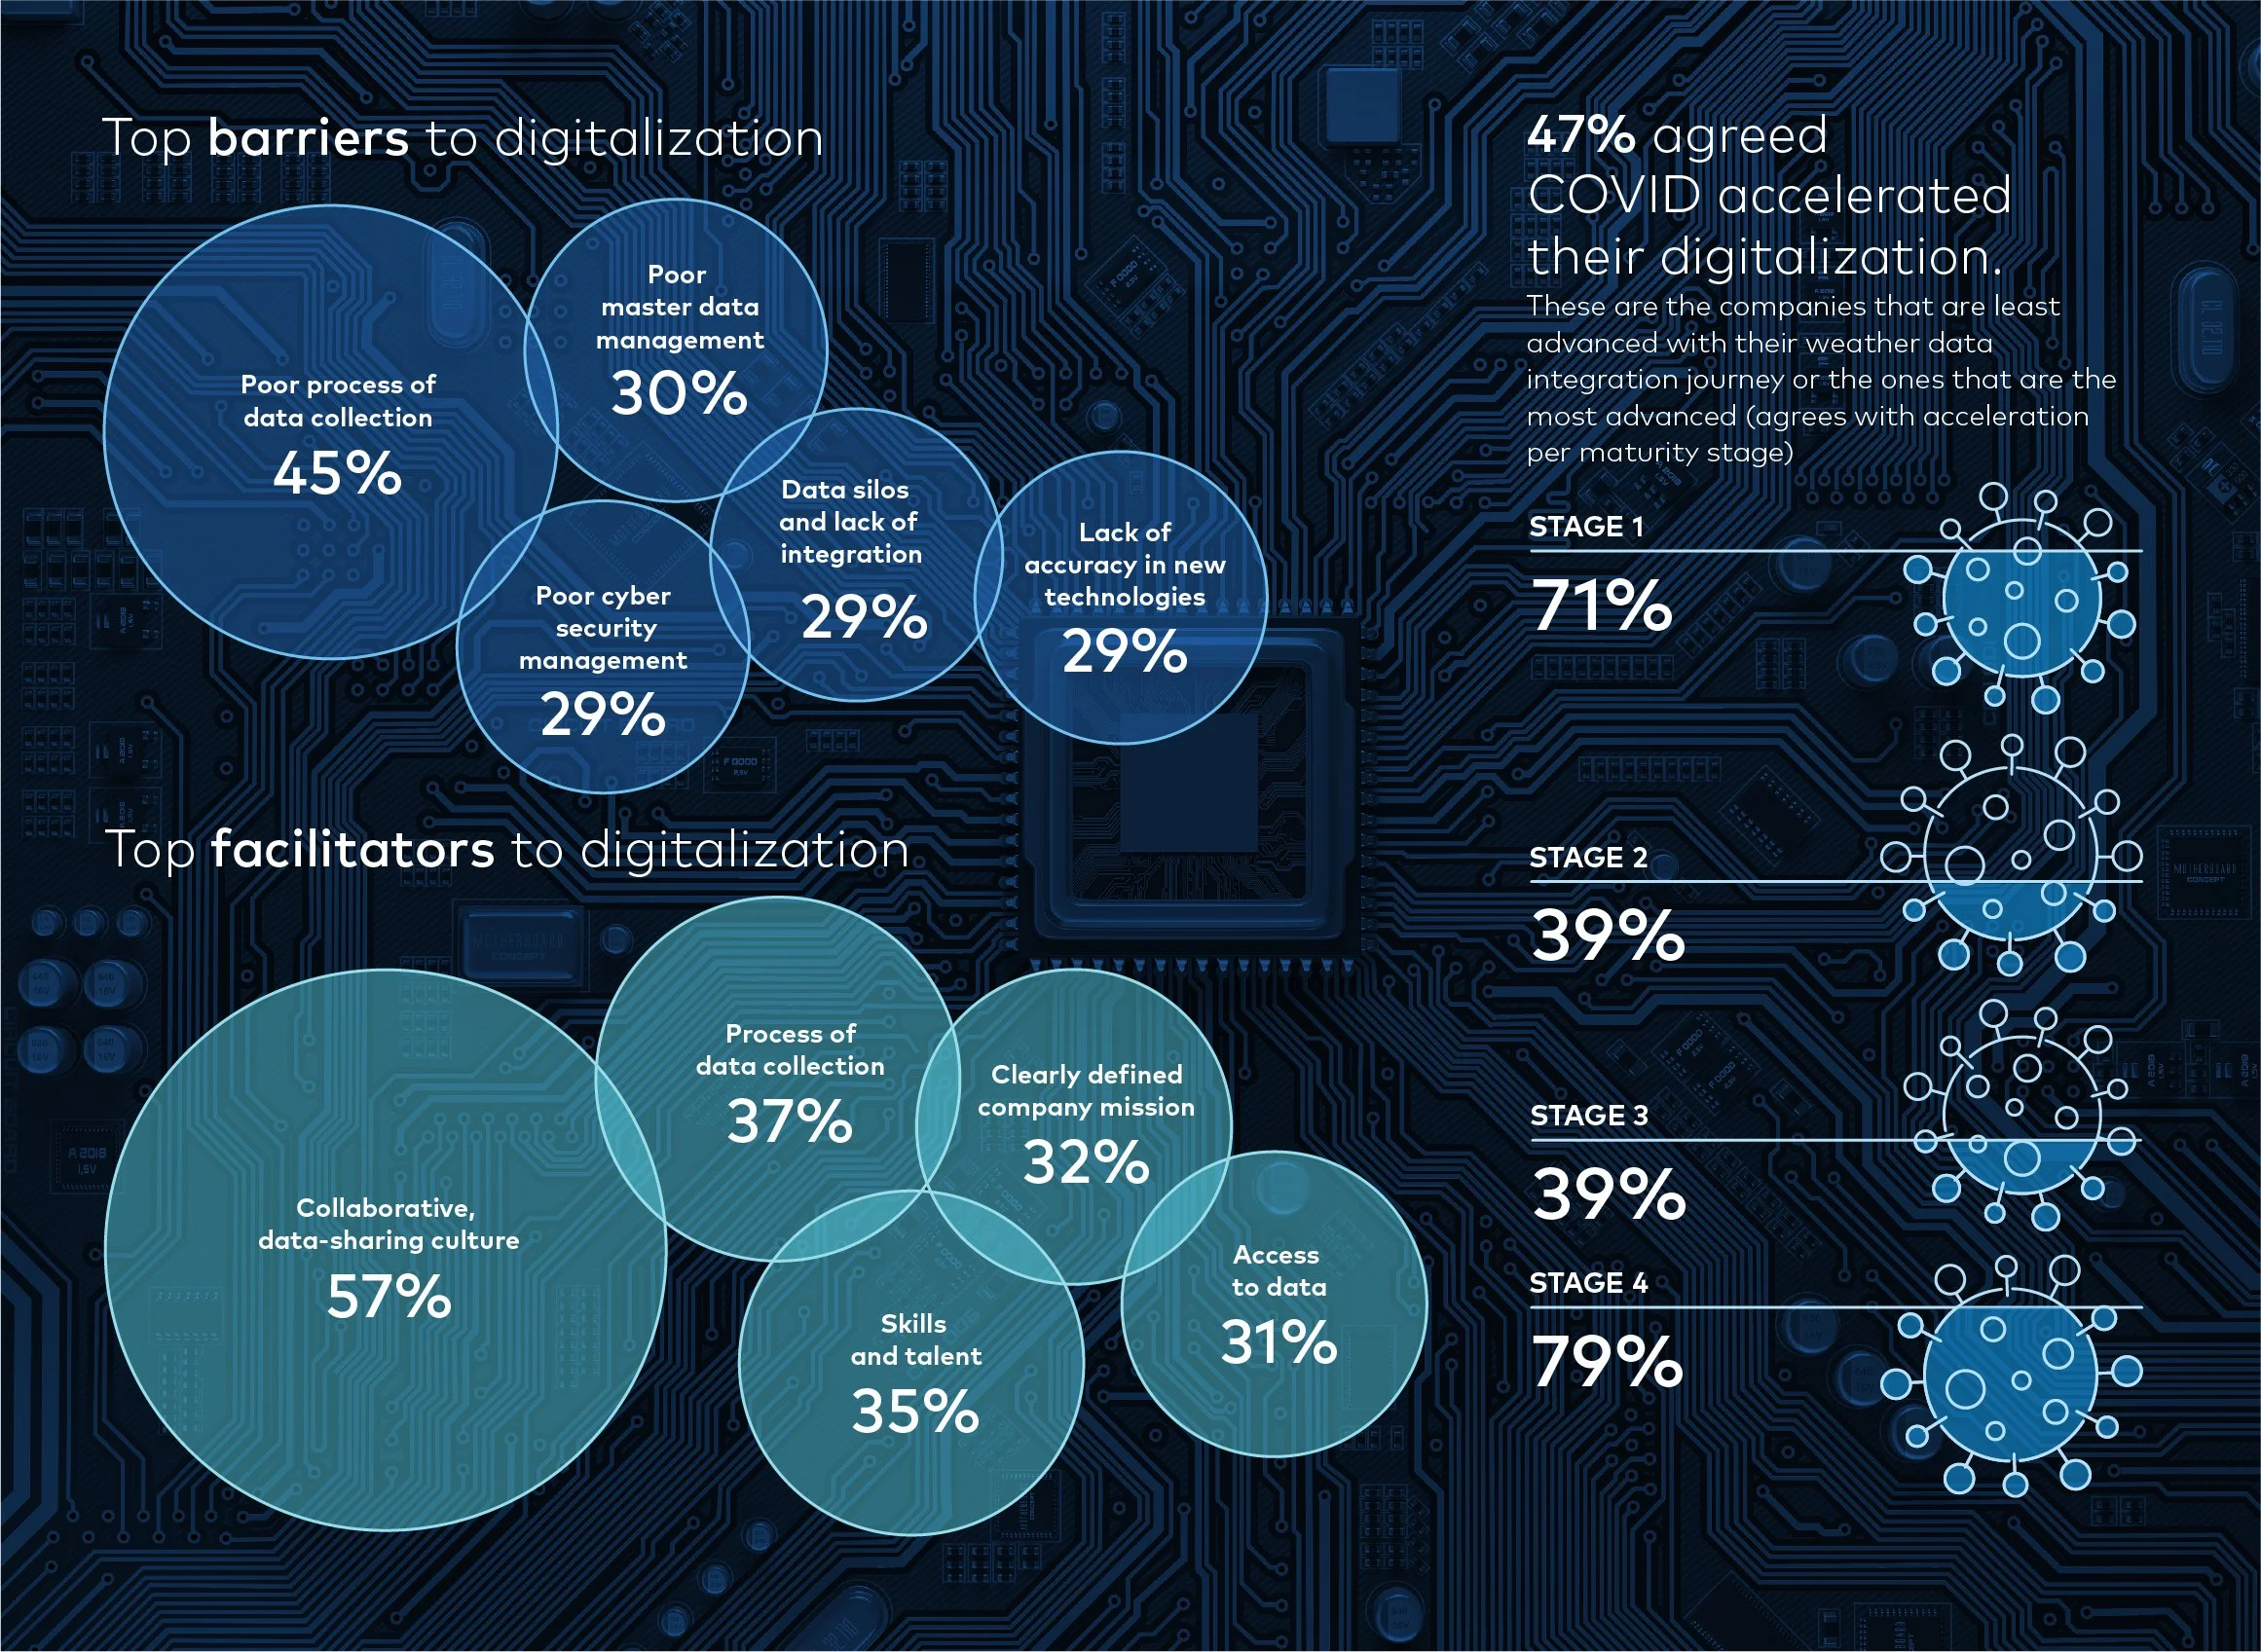
This data company had recently completed a complex study on the state of digitalization in the shipping industry and was looking to visualize their research in an easy to digest, highly graphic format to share with their stakeholders, current customers and prospective audiences.
PROCESS
Though the study was data-heavy and potentially weighty for the average reader, my goal was to create an interactive digital report that was easy to navigate, evocative of the shipping industry in color palette, line art and imagery, and filled with crisp, clean data visualization to help condense otherwise chunky content into easy-to-skim graphics.

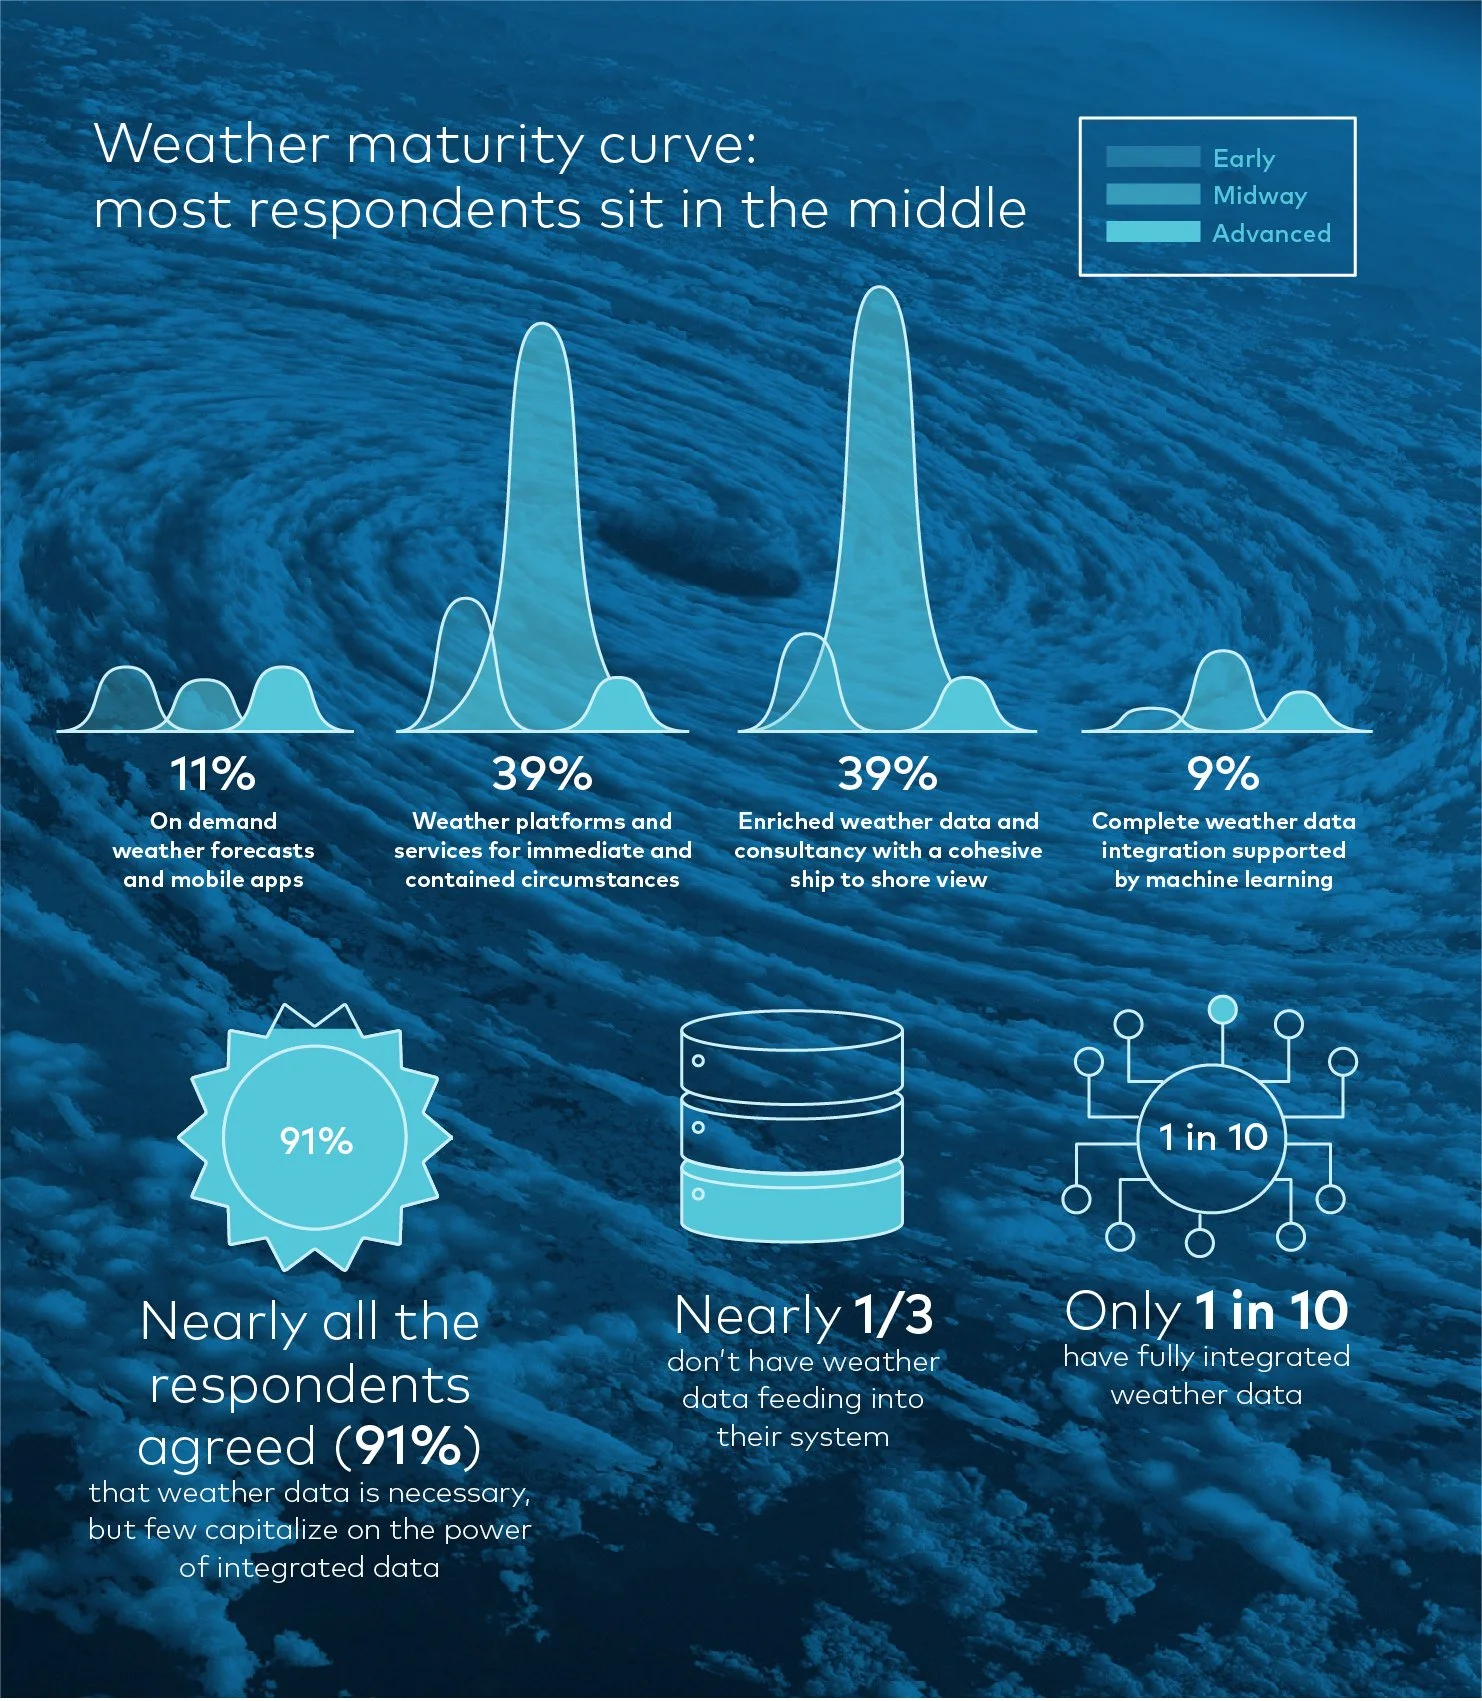
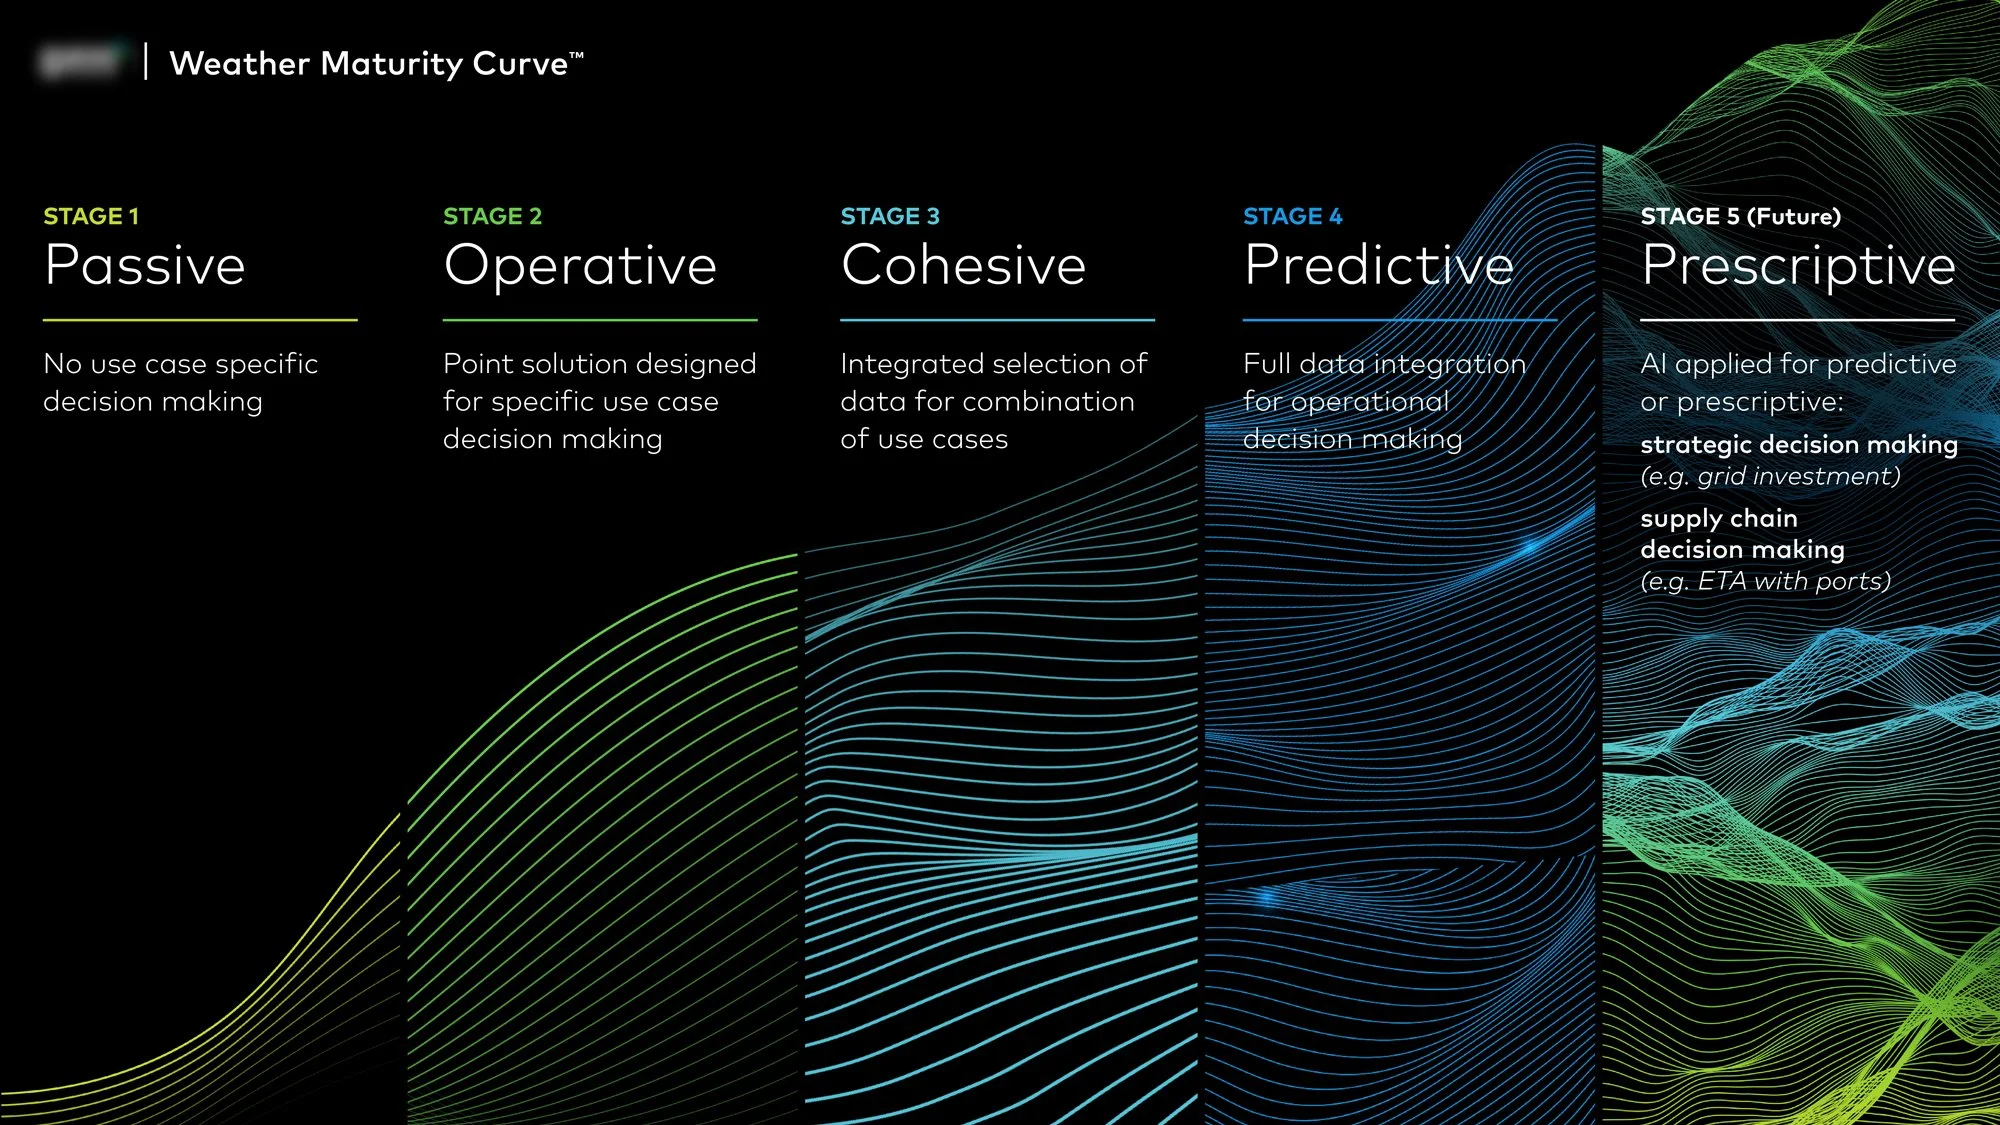
Weather Maturity Curve
Showcasing the growing stages of digitalization implementation within any given customer’s business model, and an ability to see where they fall on the curve. Design is evocative of ocean waves, with increasingly complex wave visualizations as future-forward digitalization is present.
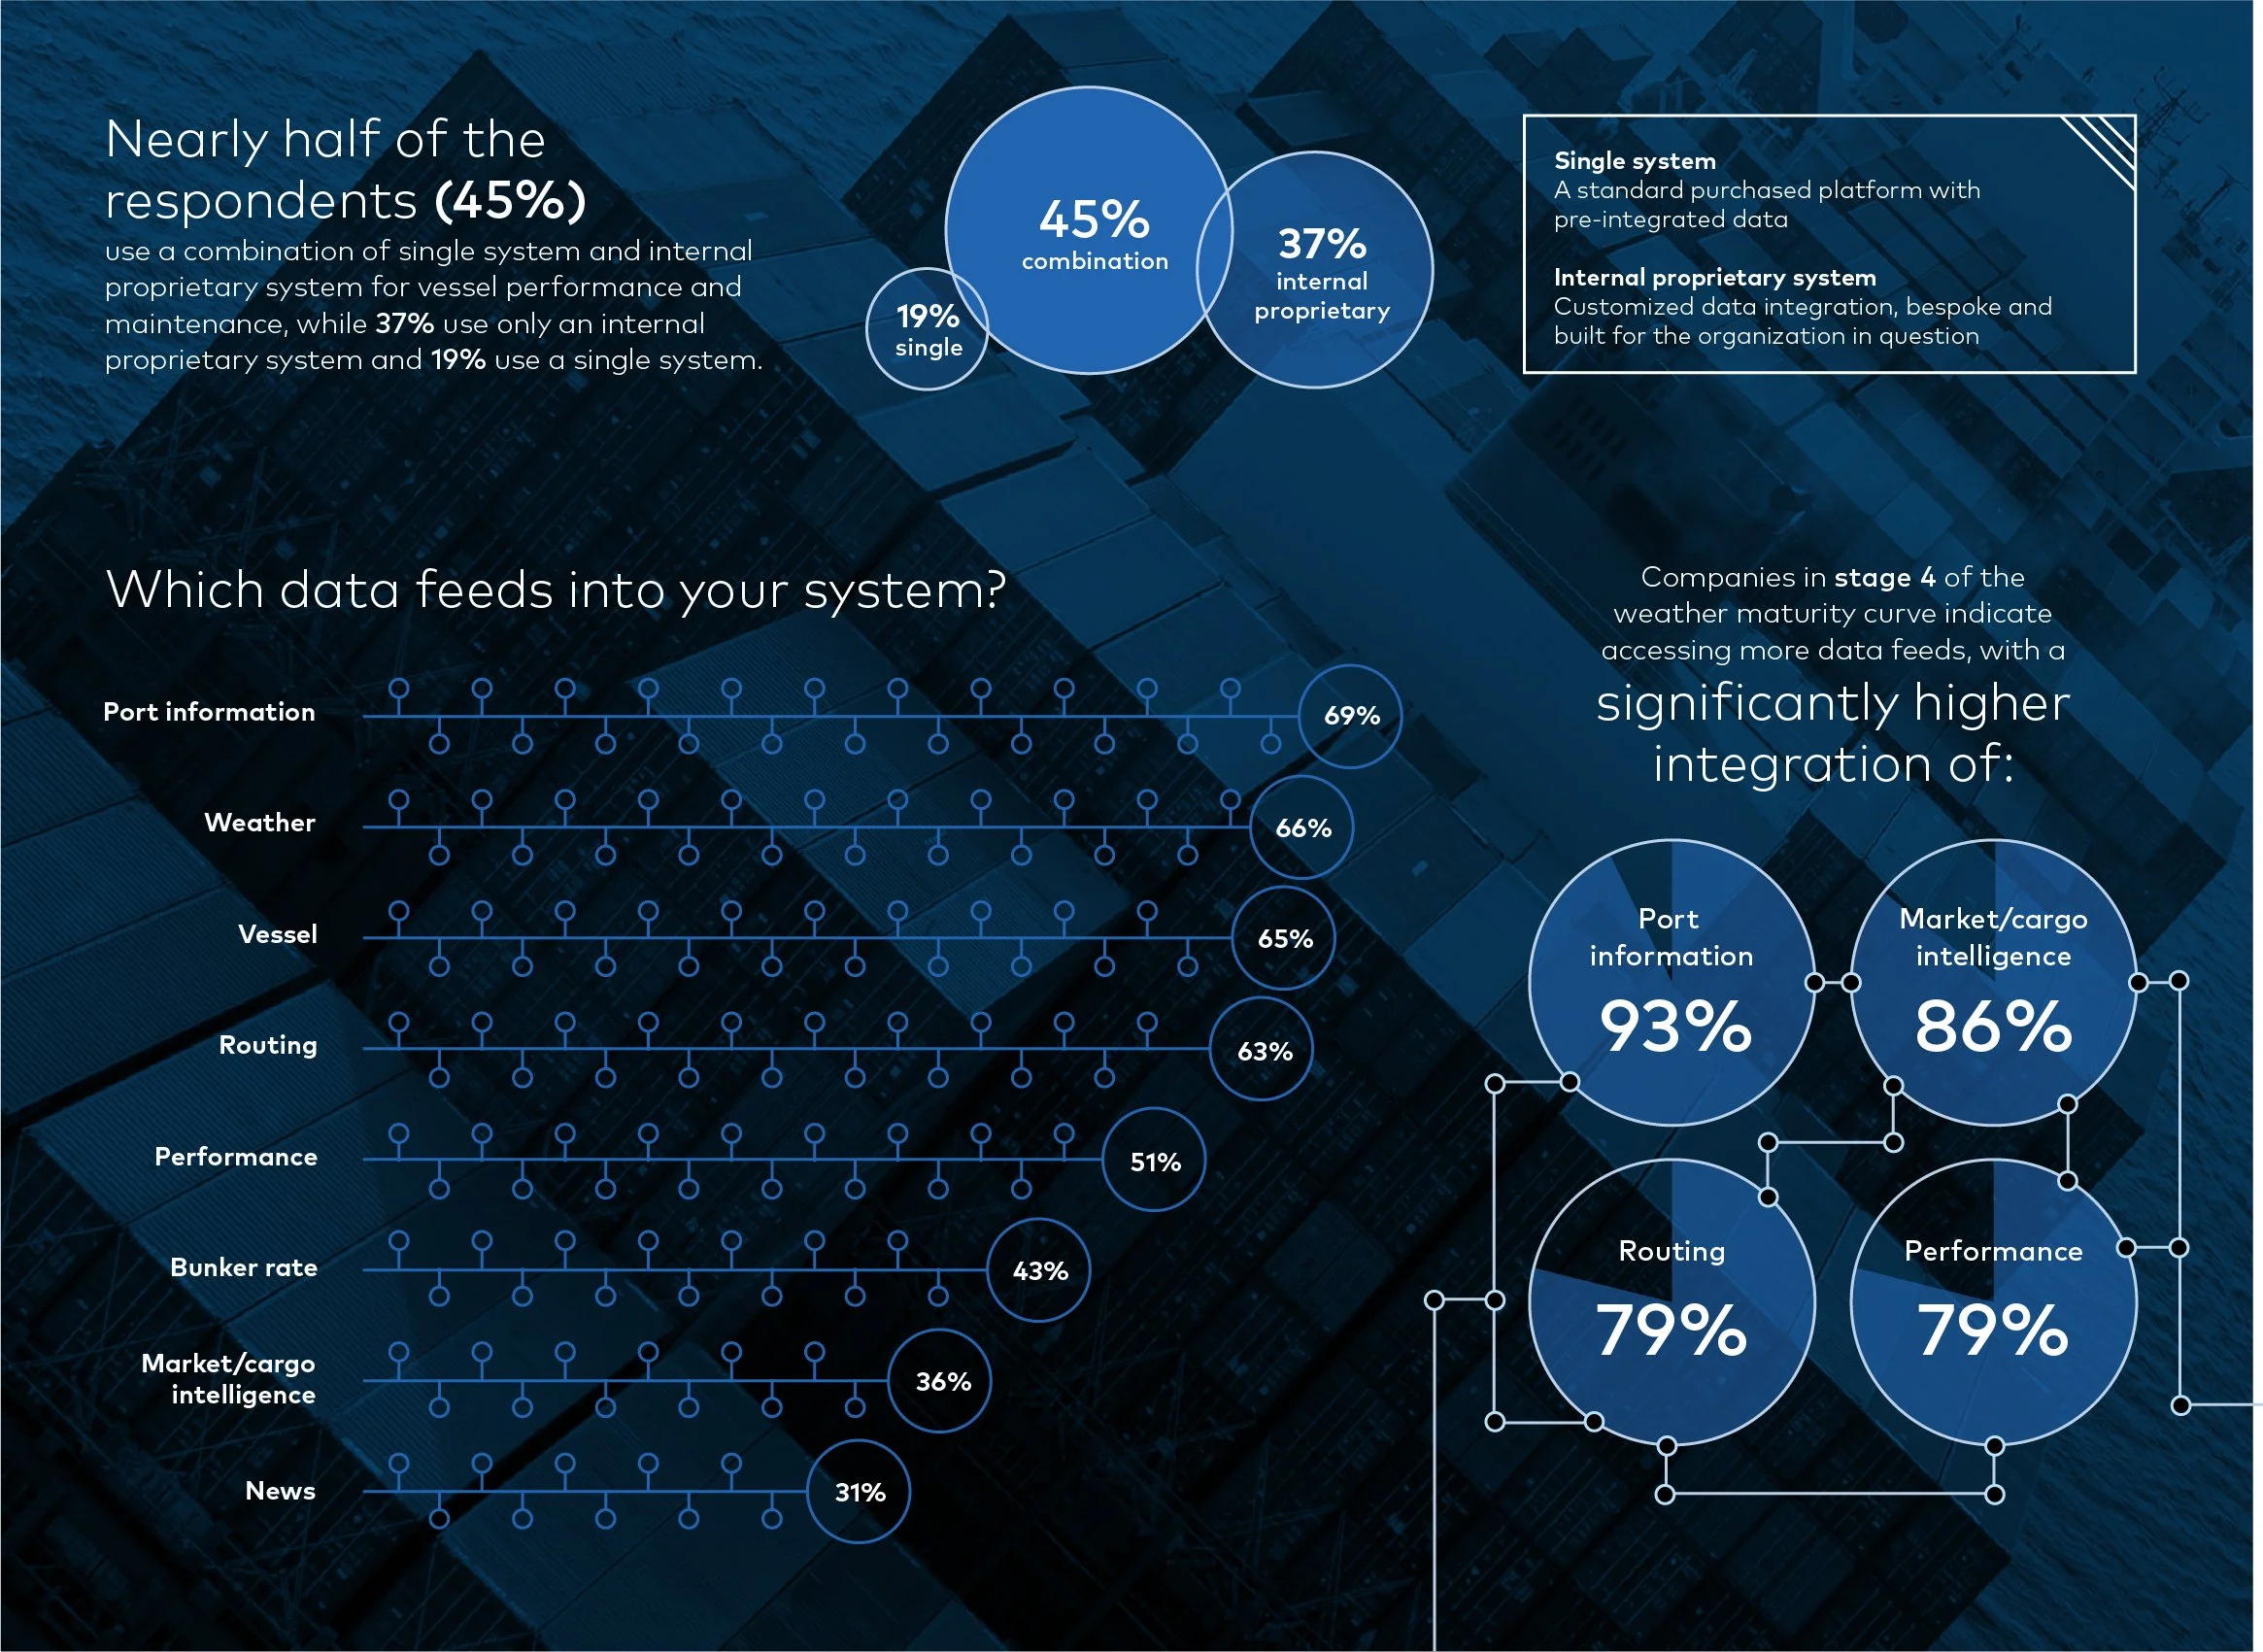
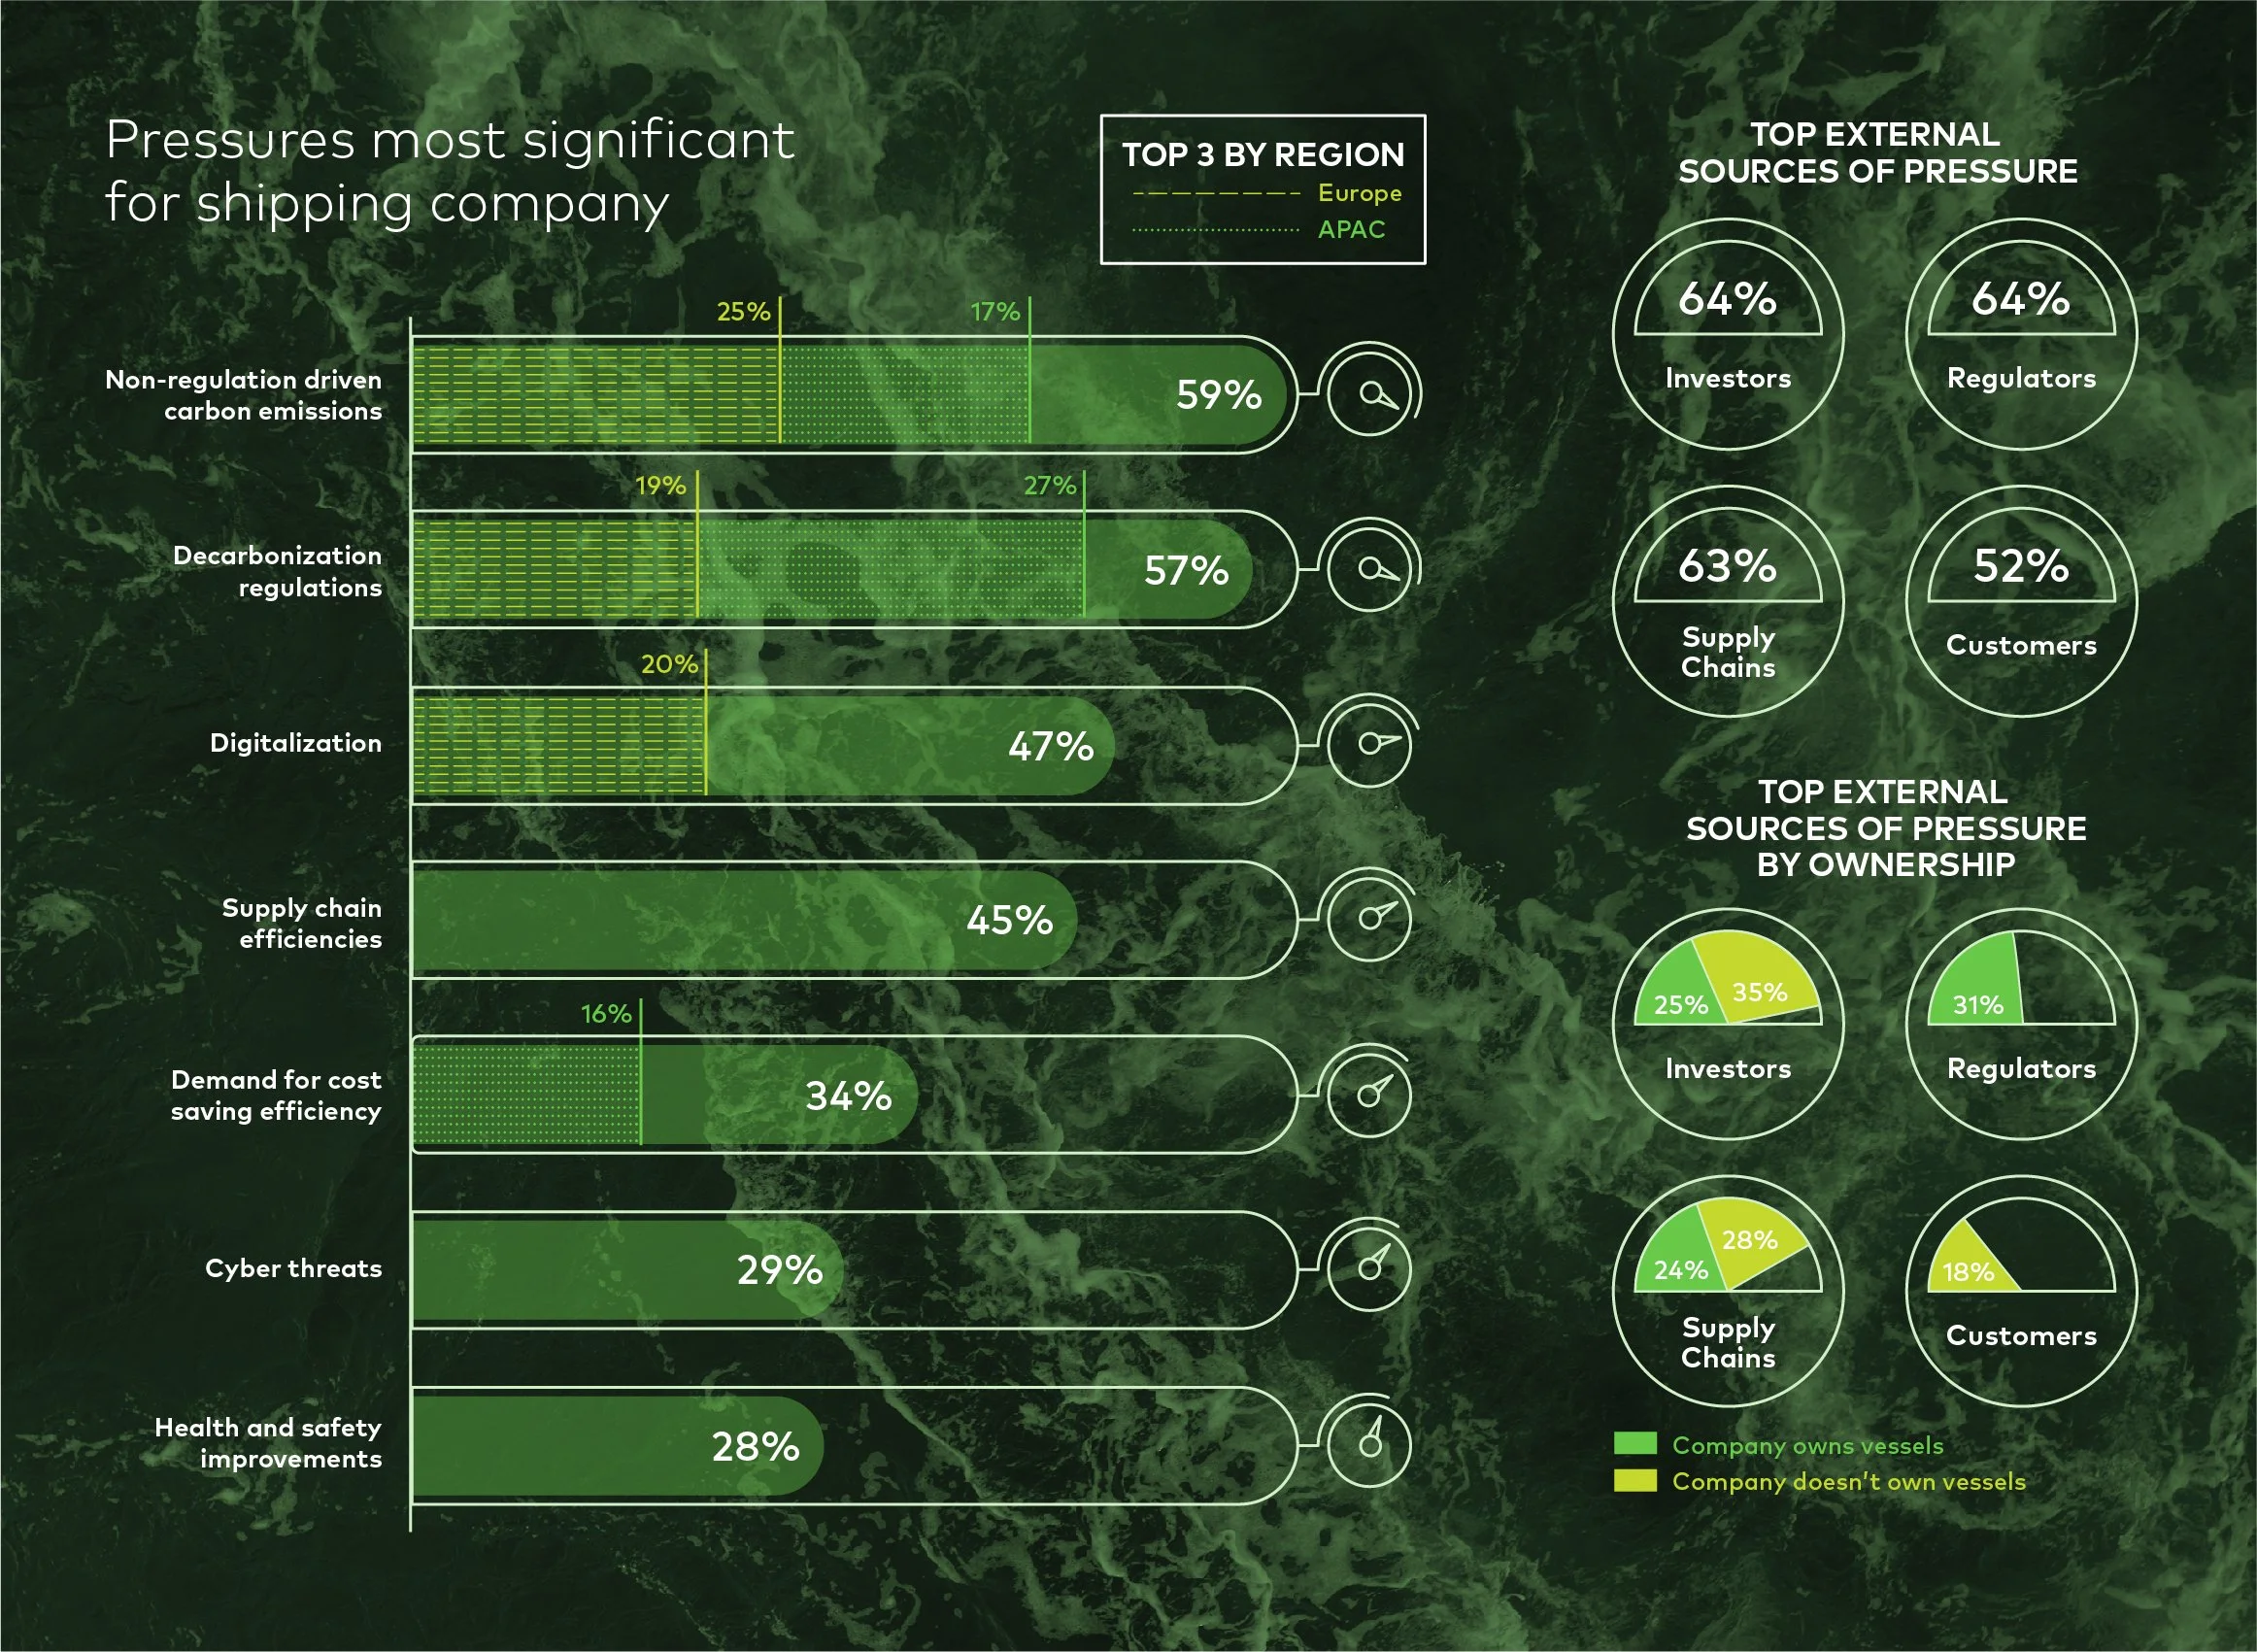
Data Visualization